
Go 1.27 can find your leaked goroutines. Here’s how it knows
By Tarun Nahak
A goroutine leak is quiet. A goroutine blocks on a channel that nothing will ever touch again and sits there for the life of the process, holding its stack and everything it references. One is harmless. One per request is a slow memory leak and a goroutine count that only goes up.
Until recently the tools for this were indirect: graph runtime.NumGoroutine, take a goroutine profile and look for suspicious piles of identical stacks, or catch leaks in tests with goleak. Go 1.27 adds a direct one. The goroutineleak profile, an experiment in Go 1.26 behind GOEXPERIMENT=goroutineleakprofile, is now generally available, and the experiment flag is gone.
A leak in a dozen lines
The most common shape I know is fan out, collect, and return early on the first error.
type result struct {
	resp Response
	err  error
}

func fetchAll(ctx context.Context, urls []string) ([]Response, error) {
	ch := make(chan result)
	for _, u := range urls {
		go func() {
			resp, err := fetch(ctx, u)
			ch <- result{resp, err} // blocks forever once fetchAll has returned
		}()
	}

	var out []Response
	for range urls {
		r := <-ch
		if r.err != nil {
			return nil, r.err // the remaining senders are now stuck
		}
		out = append(out, r.resp)
	}
	return out, nil
}
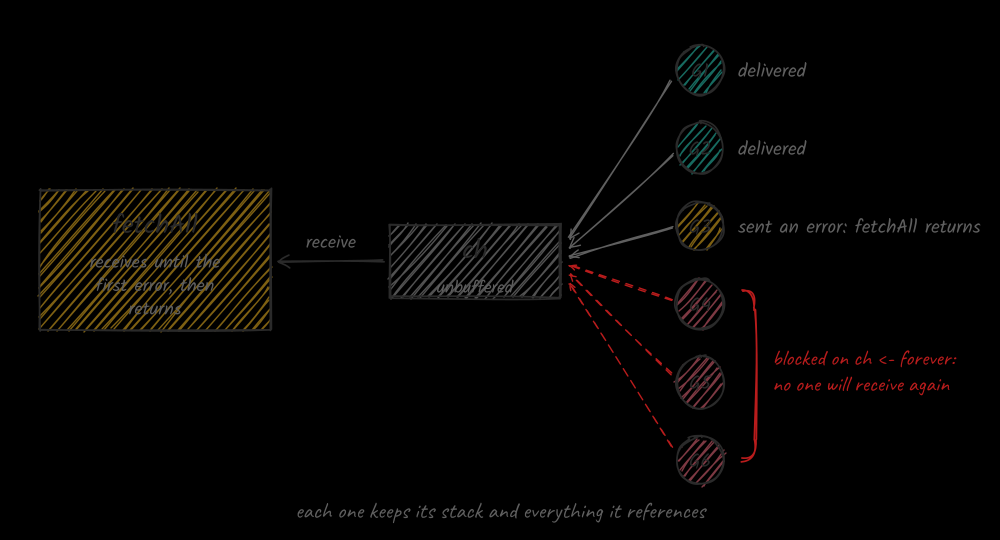
The channel is unbuffered, so every send waits for a receive. When one fetch fails, fetchAll returns, and every goroutine that hasn’t sent yet blocks on ch <- with nobody left to receive. The fix is one line, a buffer with room for every sender, make(chan result, len(urls)), or an errgroup with a context that cancels the rest.
How the runtime knows a goroutine can never wake up
You can’t tell a leaked goroutine from a slow one by looking at it. Both are blocked on a channel. The difference is whether anything still running could ever unblock it, and that’s a reachability question, which is exactly what the garbage collector answers all day.
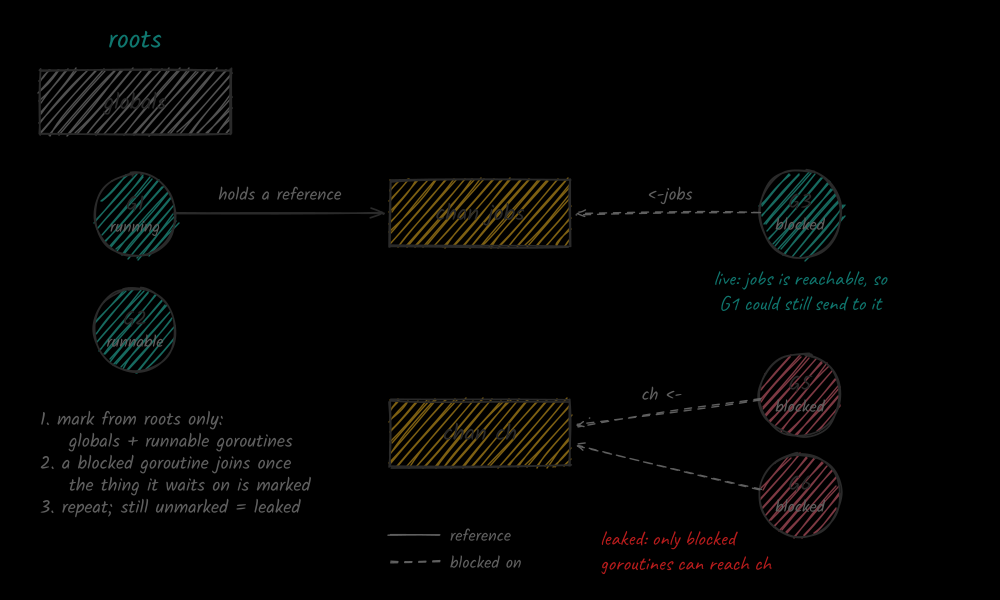
The Go blog post on goroutine leak profiles defines it precisely. A goroutine is live if it isn’t blocked by a concurrency primitive, or if at least one primitive blocking it is referenced by another live goroutine. To find the rest, the runtime adapts the garbage collector’s marking phase:
- A normal GC treats every goroutine as a root. Here, marking starts only from global variables and the goroutines that aren’t blocked.
- When marking reaches a channel or lock that a blocked goroutine is waiting on, that goroutine becomes reachable too, and marking continues from it.
- When nothing new gets marked, any blocked goroutine that’s still unmarked is waiting on something only other stuck goroutines can reach. It’s reported as leaked.
The leaked goroutines are then marked anyway, so their memory isn’t freed out from under them. The profile reports leaks; it doesn’t collect them.
It covers goroutines blocked on channel sends and receives, including on nil channels, on a select without a default case, and on sync.Mutex, sync.RWMutex, sync.WaitGroup and sync.Cond.
Reading the profile
If your service already registers net/http/pprof, there’s nothing to add. The profile shows up at /debug/pprof/goroutineleak next to the others:
curl http://localhost:6060/debug/pprof/goroutineleak > leak.prof
go tool pprof leak.prof
From there it works like any other pprof profile. top shows where the leaked goroutines are stuck, grouped by stack, and list fetchAll points at the exact line, which in the example above is the send. Unlike the plain goroutine profile, you don’t have to guess which of a thousand parked stacks are the bad ones: everything in it is a goroutine the runtime has decided can never be woken.
What it can’t see
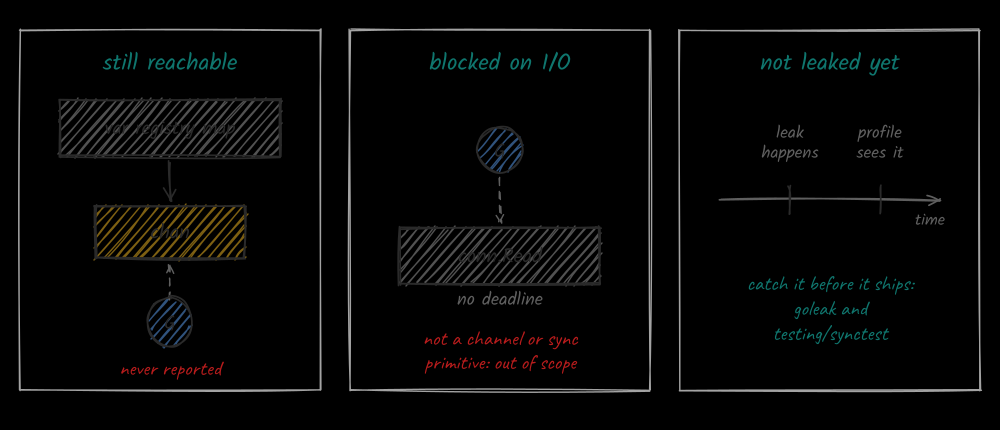
A clean profile doesn’t mean there are no leaks. The blog lists three limits, and they’re worth knowing before you trust an empty result:
- Anything still reachable. If the channel or mutex a goroutine waits on can be reached from a global variable or from a goroutine that’s still running, the waiting goroutine is never reported, even if nothing will ever use that channel again. A channel parked in a package-level map is invisible to it.
- Blocking that isn’t a channel or a sync primitive. A goroutine stuck on network or file I/O, or in a system call, is never considered leaked. A
conn.Readwith no deadline can hang forever without appearing. Deadlines and contexts are still your job. - Leaks that haven’t happened yet. The profile finds a leak after it occurs. To catch one before it ships, pair it with
goleakandtesting/synctestin tests.
There’s a cost note too. The memory overhead is negligible, but in the worst case, a long chain of goroutines each blocked on the next, detection takes O(n²) steps for one GC cycle, where n is the number of goroutines. The blog suggests tuning how often you collect it, for example every few hours, rather than scraping it continuously.
My checklist for every go statement
- Who receives what this goroutine sends, and what happens if they stop early? If there’s an early return, buffer the channel or
selectonctx.Done(). - Who closes the channel this goroutine ranges over?
- Does every network call it makes have a deadline?
- Is there a
goleak.VerifyNone(t)in the package’s tests?
And now one more: collect /debug/pprof/goroutineleak in staging after a load test. A goroutine count that only goes up used to mean an afternoon of reading stack dumps. Now the runtime hands you the line.