
Building an MCP server for debugging remote desktop sessions
By Tarun Nahak
When a remote desktop session fails, the evidence is scattered. The scheduler knows whether the job started. The session host has its own logs. The client knows which decoder it picked and whether it fell back. The network has an opinion too. Working out what happened means visiting each of those, lining up timestamps and forming a story.
At Siemens I built a diagnosis tool for exactly this, based on the Model Context Protocol, so an AI assistant can gather and correlate that evidence for whoever is investigating. This post covers the general approach: what MCP is, why it suits diagnostics, and the design rules I’d follow for any tool like it.
What MCP is
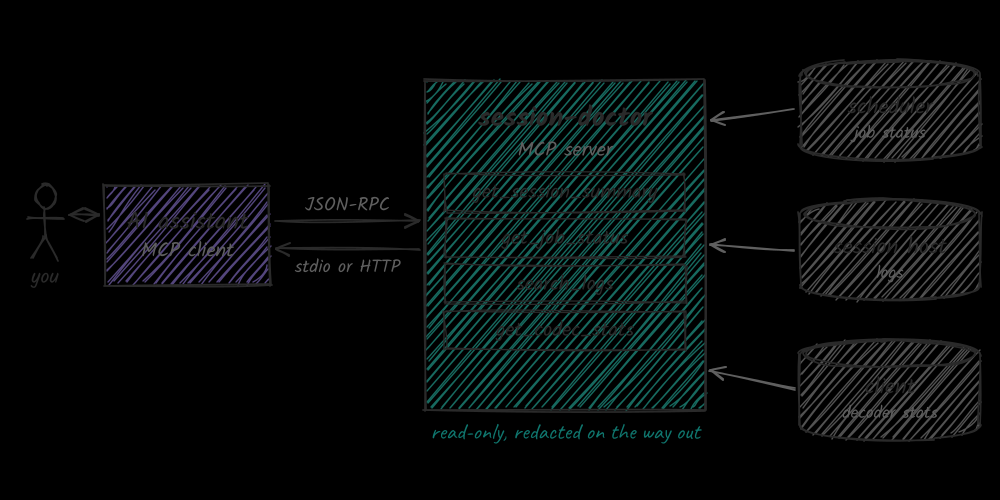
The Model Context Protocol is an open protocol for connecting AI applications to the systems they need to work with. An MCP server exposes capabilities; an MCP client, such as a chat assistant or an IDE, connects to it and makes those capabilities available to the model. The messages are JSON-RPC, carried over standard input and output for local servers or HTTP for remote ones.
A server can offer three kinds of things:
- Tools: functions the model can call, each with a name, a description and a JSON Schema for its input.
- Resources: data the client can read, like files or records.
- Prompts: reusable templates for common tasks.
For diagnostics, tools do almost all of the work. The appeal is that you write the integration once, as a server, and any MCP-capable assistant can use it.
Why diagnostics is a good fit
Root-cause analysis is mostly gathering and cross-referencing: look up the session, check the job, read the logs around the failure, compare with the decoder statistics. Each step is simple; the tedium is in doing all of them and keeping the details straight. That’s a good job for a model with well-designed tools, as long as a person still makes the final call.
Design rules for diagnostic tools
Read-only by default. A diagnosis tool should observe, not act. Restarting a session or killing a job may be the right fix, but those actions belong behind a separate, explicit path with a person in the loop. MCP lets you mark tools with a read-only hint, and clients can use it to decide what needs confirmation.
Narrow tools with typed inputs. One tool per question works better than one tool that runs arbitrary queries. Something like:
get_session_summary(session_id): state, host, timings, codec and decoder, last errorsget_job_status(job_id): what the scheduler knows about the jobsearch_logs(host, since, until, pattern, limit): a bounded window of matching log linesget_codec_stats(session_id): frame timings, decoder path and fallbacks
Return summaries, not dumps. Everything a tool returns lands in the model’s context window. Ten thousand raw log lines crowd out the reasoning. Return the relevant part, say how much was left out, and let the model ask for more with explicit limits and pagination.
Write descriptions for the model. The model picks tools by reading their descriptions, so a description should say when to use the tool, not only what it returns. “Use this first when a user reports a broken session” is more useful than “returns session data”.
Treat errors as data. “No session with that ID; check the job output for the correct one” lets the model recover. A stack trace doesn’t.
Return the IDs that connect things. If the session summary includes the job ID and the host, the model can chain into the next tool without guessing.
Redact on the way out. Logs contain user names, paths and sometimes tokens. Strip what the investigation doesn’t need before it leaves the server.
A minimal tool
Here is the shape of one tool using the official TypeScript SDK. The lookup function is a stand-in for whatever read-only data source you have:
import { McpServer } from '@modelcontextprotocol/sdk/server/mcp.js'
import { StdioServerTransport } from '@modelcontextprotocol/sdk/server/stdio.js'
import { z } from 'zod'

const server = new McpServer({ name: 'session-doctor', version: '0.1.0' })

server.registerTool(
  'get_session_summary',
  {
    description:
      'Summarise one remote desktop session: state, host, codec, decoder ' +
      'and the most recent errors. Use this first when a user reports a ' +
      'broken or slow session.',
    inputSchema: {
      sessionId: z.string().describe('Session ID from the user or the job output'),
    },
    annotations: { readOnlyHint: true },
  },
  async ({ sessionId }) => {
    const summary = await loadSessionSummary(sessionId)
    if (!summary) {
      return {
        content: [{ type: 'text', text: `No session ${sessionId}. Check the job output for the right ID.` }],
        isError: true,
      }
    }
    return { content: [{ type: 'text', text: JSON.stringify(summary, null, 2) }] }
  },
)

await server.connect(new StdioServerTransport())
Most of the effort goes into loadSessionSummary and its siblings: deciding what a useful summary contains, and keeping it small.
What an investigation looks like
Take a typical report: a session froze after a few minutes. With tools like the ones above, the assistant fetches the session summary, sees a decoder fallback shortly before the freeze, pulls the codec statistics to confirm frame times climbing, then searches the client logs in that window and finds the decoder being reinitialised after a display change. The person investigating gets that timeline with the evidence attached, instead of spending the first half hour collecting it.
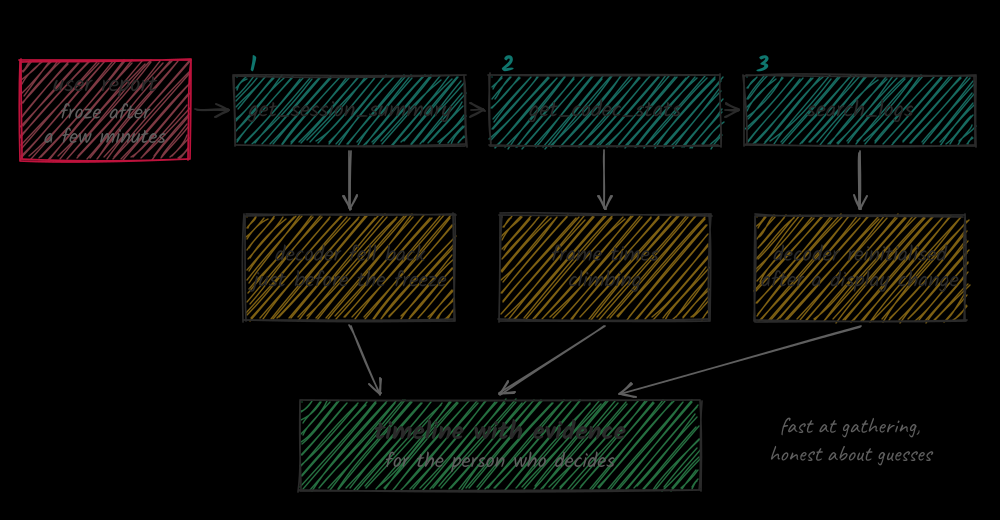
The assistant doesn’t need to be right every time to be useful. It needs to be fast at gathering, and honest about what it found and what it’s guessing.
Lessons
- Start with three or four tools. Add more when you see the assistant reach for something it doesn’t have.
- Log every tool call. The transcripts show which tools get used, which get misused, and which descriptions need rewriting.
- Test against past incidents. Replaying problems you’ve already solved is the cheapest way to check that the tools lead to the right answer.
MCP doesn’t make diagnosis automatic. It makes the dull part fast, which leaves people more time for the part that needs judgement.