
Where the memory goes in a Tokio service
By Tarun Nahak
Rust makes classic leaks rare. You don’t forget to free memory, and the borrow checker won’t let you use memory after it’s freed. So when an async Rust service climbs to several gigabytes, the cause is almost never a leak in the C sense. It’s memory that something is legitimately holding, in a place you weren’t looking.
These are the four places I look.
1. Futures are bigger than they look
Tokio tasks are cheap. The Tokio tutorial says a task needs “only a single allocation and 64 bytes of memory”, and that applications can spawn thousands, even millions, of them. What those 64 bytes don’t include is the future itself, and the future lives in that same allocation.
An async fn compiles to a state machine, and every local that’s alive across an .await becomes a field of it. Futures you await are stored inline too, with their own locals, all the way down. So this innocent-looking handler costs 64 KiB per connection for its whole life, whether it’s reading or not:
async fn handle(mut socket: TcpStream) -> io::Result<()> {
    let mut buf = [0u8; 64 * 1024]; // lives in the future, across every .await below
    loop {
        let n = socket.read(&mut buf).await?;
        if n == 0 {
            return Ok(());
        }
        socket.write_all(&buf[..n]).await?;
    }
}
A hundred thousand idle connections is over 6 GiB of buffers, and nothing is leaking.
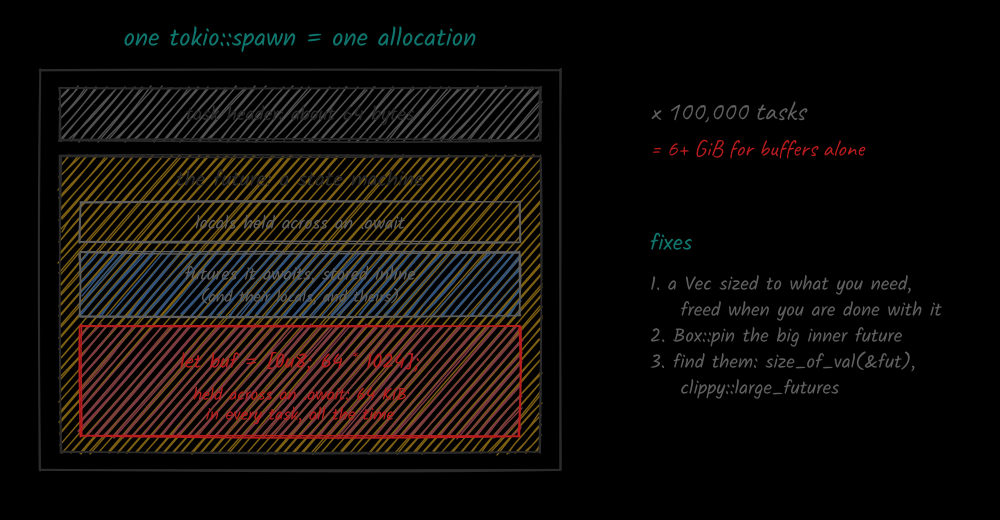
Finding these is easy once you know to look:
std::mem::size_of_val(&fut)on a future, before you spawn it, gives its size. A small test that checks it catches regressions in the futures you spawn per connection or per message.- Clippy’s
large_futureslint flags futures over a size threshold, 16 KiB by default. It’s in the pedantic group, so you have to turn it on. - tokio-console has
large-futureandauto-boxed-futurewarnings, the second for futures the runtime boxed because they were large.
The fixes: keep big buffers in a Vec or BytesMut sized to what you actually need, or Box::pin a large inner future so it gets its own allocation while it runs instead of living inside every outer future. Large futures can also overflow the stack before they’re ever spawned, which is the other reason Clippy warns about them.
2. Queues without backpressure
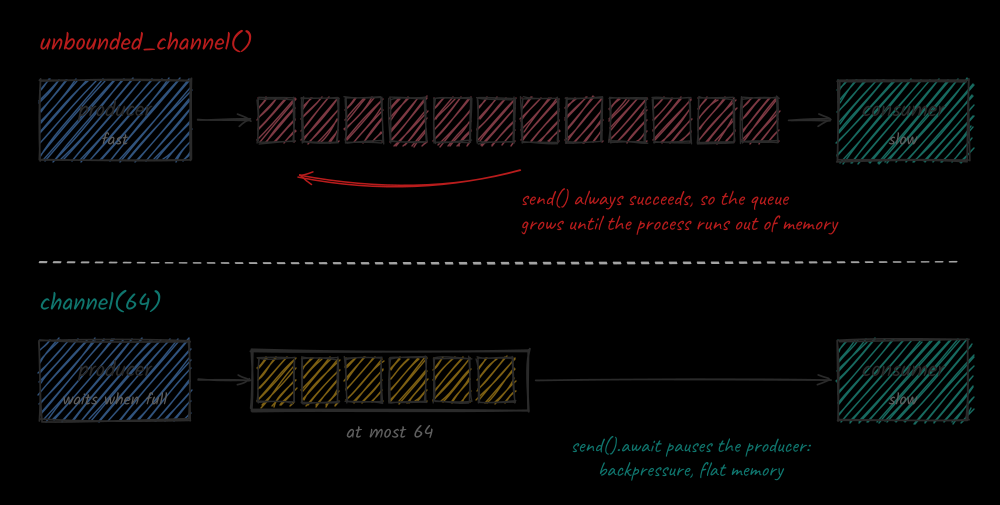
The second place is any queue that can grow without limit. Tokio’s unbounded_channel docs are blunt about it: it’s a channel “without backpressure”, and if the receiver falls behind, messages are “arbitrarily buffered”. The only real limit is system memory, and when that runs out the process is aborted.
A bounded channel turns that failure into a slowdown. With mpsc::channel(64), send().await waits while the queue is full, so the producer runs at the consumer’s pace and memory stays flat.
let (tx, mut rx) = tokio::sync::mpsc::channel::<Event>(1024);

// producer: waits here instead of piling up events while the consumer is behind
tx.send(event).await?;
The same thinking applies to anything that buffers: a Vec you push to in a loop, a stream with buffer_unordered, a cache without eviction. For broadcast channels, remember that the capacity is rounded up to the next power of two and allocated up front, and that a receiver which falls too far behind gets a Lagged error and skips the oldest messages rather than growing the buffer.
3. The allocator is holding it, not you
This one looks exactly like a leak. Traffic spikes, memory climbs, traffic drops, and resident memory (RSS) stays high for hours, while a heap profile shows live allocations back at their baseline. Nothing is leaking. The allocator is keeping freed memory instead of returning it to the operating system.
On Linux, Rust uses the system allocator by default, which is usually glibc’s malloc. glibc gives threads separate arenas to reduce contention, and the arena limit is usually a multiple of the number of CPUs. Each arena is its own heap, and the mallopt man page notes that a heap can be trimmed only if memory is freed at the top end. One long-lived allocation near the top of an arena keeps all the freed space below it. A multi-threaded Tokio runtime runs work on many threads, so there are many arenas, each holding its own leftovers.
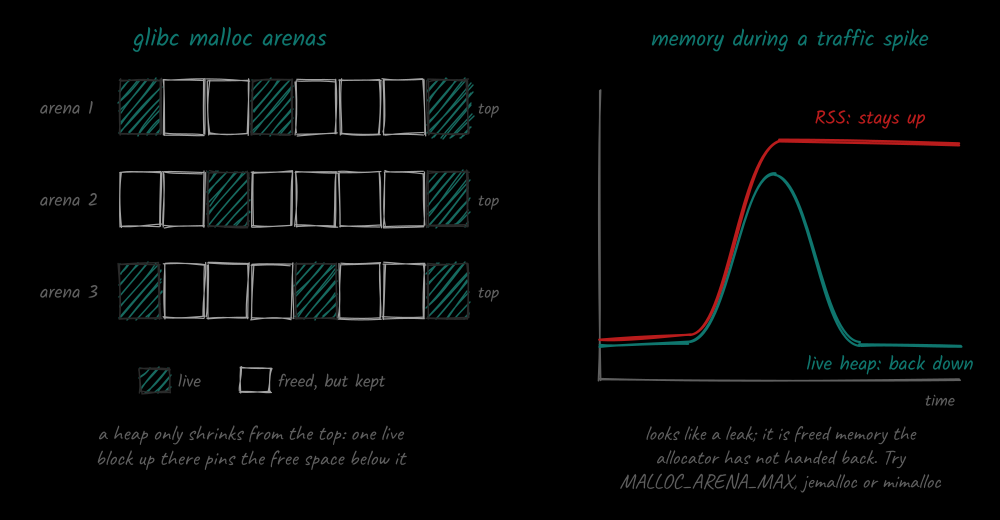
Two fixes, in order of effort:
- Cap the number of arenas with the
MALLOC_ARENA_MAXenvironment variable, for exampleMALLOC_ARENA_MAX=2, and measure. Fewer arenas means less memory stuck in leftovers, at the cost of more contention. - Switch the global allocator. jemalloc and mimalloc often hold far less memory for this kind of workload, and the switch is a few lines:
// Cargo.toml:
// [target.'cfg(not(target_env = "msvc"))'.dependencies]
// tikv-jemallocator = "0.7"

#[cfg(not(target_env = "msvc"))]
#[global_allocator]
static GLOBAL: tikv_jemallocator::Jemalloc = tikv_jemallocator::Jemalloc;
Whichever you pick, compare RSS under the same load test before and after. Allocator behaviour depends on the workload, and your own numbers are the only argument that counts.
4. Tasks that never finish
The last place is the closest thing to a real leak. Dropping a JoinHandle doesn’t cancel a Tokio task; it detaches it. A spawned loop that waits on a channel whose sender is kept alive somewhere, or that retries forever, keeps its future and everything it captured, often an Arc of shared state, until the process exits.
The tool for this is tokio-console, which its README describes as “like top(1) for tasks”. It needs the tokio_unstable cfg and one line of setup:
// build with: RUSTFLAGS="--cfg tokio_unstable" cargo build
#[tokio::main]
async fn main() {
    console_subscriber::init();
    // ... the rest of your service
}
Run tokio-console next to it and look at task counts and idle times. A count that only grows, or a pile of tasks spawned from the same line that have been idle for hours, points straight at the loop that never exits. The fix is usually an exit condition: a CancellationToken, a channel that gets closed, or a JoinSet whose tasks are aborted when it’s dropped along with its owner.
Where to start
- Compare RSS with the live heap. If the heap is flat and RSS isn’t, it’s the allocator.
- Count tasks over time. If the count only grows, find the task that never ends.
- Look for unbounded queues on the hot path.
- Measure the futures you spawn per connection or per message.
None of these is a bug the compiler can catch, and none of them shows up in a small test. They appear under real load, a few hours in, so it pays to know where to look before then.